Table of Contents
Service logs are the fastest way to understand why an application fails, crashes, or behaves unexpectedly on a Linux VPS.
Step 1: View Logs for a Specific Service
Use journalctl to read logs managed by systemd.
sudo journalctl -u nginxReplace nginx with the service name you want to inspect.
Step 2: Show Recent Log Entries Only
Limit output to recent events for faster debugging.
sudo journalctl -u nginx --since "15 minutes ago"This helps identify recent configuration or restart issues.
Step 3: Follow Logs in Real Time
Stream logs live while restarting or testing a service.
sudo journalctl -u nginx -fUseful for catching errors as they happen.
Step 4: Filter Logs by Priority Level
Focus only on errors or warnings.
sudo journalctl -u nginx -p errAvailable levels include info, warning, and err.
Step 5: Check Traditional Log Files
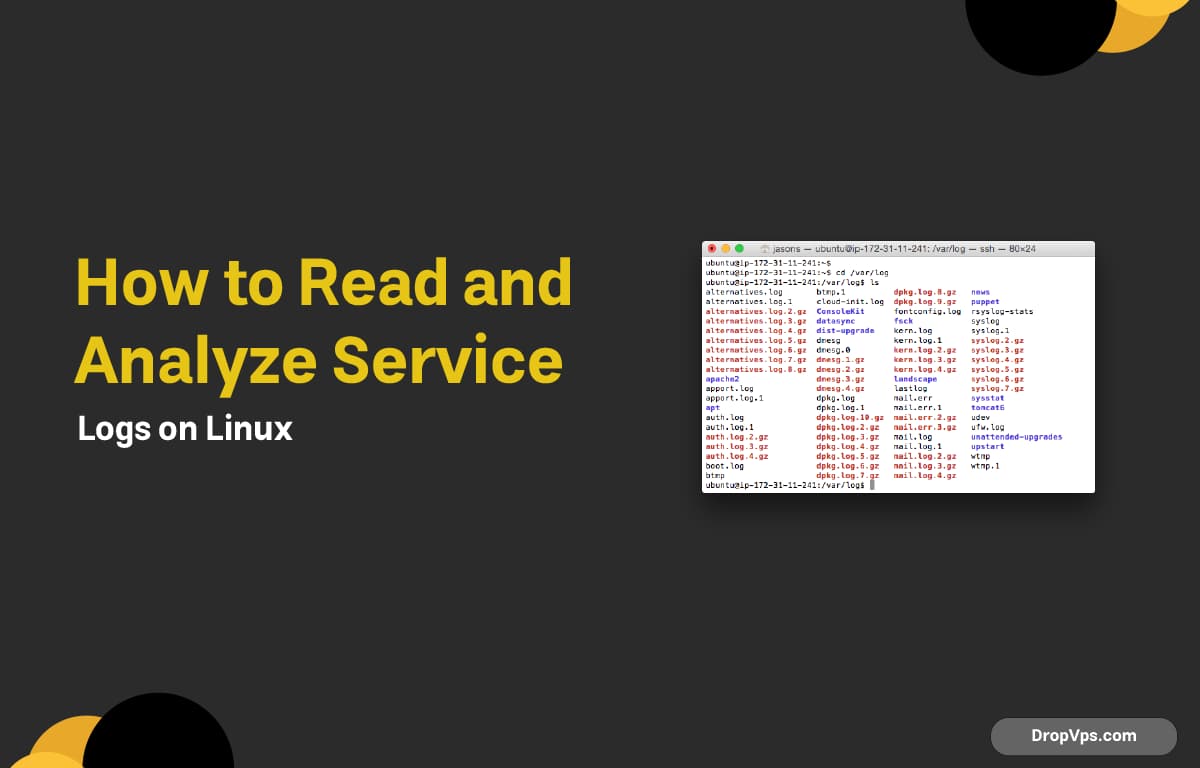
Some services still write logs to files in /var/log.
ls /var/logExample for Nginx:
sudo tail -n 50 /var/log/nginx/error.logStep 6: Search Logs for Errors
Use grep to locate specific error messages.
sudo journalctl -u nginx | grep -i errorHelpful when logs are large.
Step 7: Analyze Logs After a Crash or Reboot
Review logs from the previous boot session.
sudo journalctl -u nginx -b -1You may also want to review this related article: Restart, Stop, and Debug Services with systemctl
Optional Step: Export Logs for External Analysis
Save logs to a file for sharing or deeper inspection.
sudo journalctl -u nginx > nginx.log